Sunday, January 29, 2006

Mexico.........

This weekend I was up to my usual sniffing around the usual Blogs and Inet sites and this article came to my attention. So I ran a chart.........the iShares Mexico - EWW.

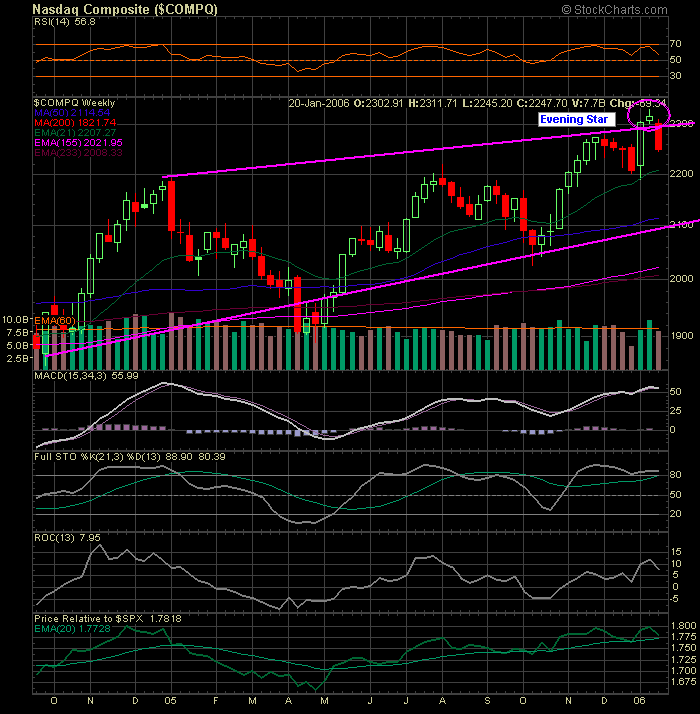
Notice how the bubble has gone global, first thought. Second thought, what other emerging market segments could also be overdone and good shorting opportunities in the months ahead (more on that later). But back to Mexico, this chart is forming a blowoff top. The P&F chart is still calling for a price of 41.50 - and I will watch this like a hawk in the weeks ahead.

After these charts read the article that caught my eye.

The daily charts is showing signs of bearish negative divergence!


Here is the article:

West

-------
January 26, 2006
NOTE: PLEASE say if you DON'T want your name and/or email address published when sending VDARE email.
ResistingDefamation.Org’s Bo Sears Comments On “Citizenism” vs. White Nationalism
Today’s Letter: A Reader Predicts the Collapse of Mexico
From: John H. Ciccolo, Jr. (e-mail him)
Re: Joe Guzzardi’s Column In Looming Battle Public Relations Battle for Americans’ Hearts and Minds, Mexico Will Lose.
Regarding Guzzardi’s column, the fly in the ointment will be another patented collapse of the Mexican economy.
Consider:
1. PEMEX - peak oil for the Cantarella field will be late 2006 or early 2007. This field accounts for 75% of Mexican oil production. The decline will be swift—10-20 percent per year. Fox just redirected more than $2 billion in exploration funds to political parties for this year's election. Pemex is $43 billion in debt. A friend at Exxon-Mobil says no U.S. major will touch Mexico now because of its corruption. Mexico has received no offers to help explore the promising deep-water Gulf. Mexico can't afford to do it on its own: no money and no expertise. (Of course, because of national pride, many other industries are out of bounds to foreign investment.)
2. Remittances. Understand that remittances are not exclusively an indicator of the number of illegals already here. They are also an indicator of the growth rate of those illegals. Dad comes to U.S., sends money home for a while, wife & kids come (remittances fall or stop). If all Mexicans came here tomorrow, there would be no remittances.
The level of remittances probably reflects the pressure for future illegal immigration. No matter what happens with HR 4437 remittances will plummet over the next three or four years. If open borders wins, family reunification will reduce remittances, if they lose, then senders will return home...either way less money will be transferred south.
3. Drugs. Guzzardi’s suggestion to decriminalize marijuna, if adopted, would collapse Mexico tomorrow. Estimated $128 billion per year heads south from U.S.. This money shows up in U.S. International Statistics as "errors and omissions" and does not show up at all in Mexican accounts, which resemble Al Capone's tax returns.
Take $128 b. + $ $20 b. (remittances) + $10 b. (smuggling) and divide by the total Mexican population and you get $1600 for every man, women and child.
4. Manufacturing. Finally, it is becoming clearer almost daily that India and China are lower cost producers of an increasing number of manufactured products. I first noticed this while assembling computers that I install for cash register systems. First, Mexican modems stopped, then the network cards and now the video cards. Another friend at a Long Island company that designs printed circuit boards (TV cards, video cards, etc.) tells me that nothing has been manufactured in Mexico for at least two years. My auto mechanic claims that many Ford parts originally produced in Mexico now come from China. I believe it is also true that the share of Mexican GDP from manufacturing has fallen over the past decade. That share is only 23% (2004).
The incompetence, xenophobia and corruption of the Mexican ruling class has made it impossible for many hardworking people with the most modest dreams to function in that damned country.
A 1994-like collapse is a foregone conclusion.
The implications of this are appalling: a massive assault on our southern border

Saturday, January 28, 2006

XAU looking scary!

The 12 1/2 CYCLE draws to its close. This in all my trading has to be the perfect chart! A perfect bowl, a perfect retrace of its starting point. When the upside parabol of this channel breaks - its gonna fall hard and fast. How and why, pure technicals.


The parabolic blowoff is near.......very near.

This has to have the big technical traders getting ready to lock some profits.

Notice also the last tops - May 2002/January 2003/December 2004.

Febuary 2005?

MACD and ROC at extremes, record for the weekly chart.


Once the blue line turns down I am loading short big, really big.

West

Friday, January 27, 2006

Banking Index calling a top?

This could hold all the keys to this market. Forget the SPX chart, its main component is the financials. Also it would seem to me that this is the one chart the FED must watch like a hawk! Since this whole house of cards needs the banks to remain stable and since the FED is a group of Private Banksters.

Check out what I found, look at this overhead, this is a Three Mountain Top.....as good as it gets.

And you wonder why the FED greased M3 in October (see my M3 post on that data) - look at that collapse back in October!

Look at that negative divergence on the indicators - can they break out?

So 372 - that is all we care about, they take it out, long, it holds short. Simple, maybe.


West

Wednesday, January 25, 2006

Gold Update

Gold Continues to show its blowoff parabolic top to the 12 1/2 year cycle. All the signs are there in the overbought indicators.


Gold Monthly:


In this chart the MACD is showing signs of this parabolic finish to golds run.


Gold Weekly:


We watch and monitor, daily - updates will continue......

West

Tuesday, January 24, 2006

America follows Japan

Look at these two charts, and what do we see. Instead of using words I will let the charts do the talking.

This is the Dow Jones World Stock Index in its present form.


This is the Japan Nikkei - 1996 to 2000


It has been interesting, many technical analysts over the past several years have shown how our stock markets have followed Japans bust. Why? In one word - a deflationary collapse. The one coming in America will makes Japans look tame. So we follow Japan, for signs of what is to come in America.

West

COMPAQ Major Topping Pattern

'Evening Star' - a major top reversal pattern formed by three candlesticks. The first is a tall white real body, the second is a small real body (green or red) which gaps higher to form a star, the third is a black candlestick which closes well into the first session's green real body.

Steve Nison - Japanese Candlestick Charting Theory


THIS CANNOT BE IGNORED.....trade accordingly.

West

Ian McAvity's 'Busted Bubble Model'

Nasdaq will not see more than 2200 +/- 10% for the next decade or two ahead!

Read his full and brilliant thesis here:

http://www.kitcocasey.com/displayArticle.php?id=162


West

Monday, January 23, 2006

Dollar Crash? - Support GONE

The US Dollar has broken under 88 today, its final support point at 88.57 its 200 DMA. We still have support points at 86.02, 81.28 and 80.39 - let's watch these in the months ahead. 80.39 says flee if it is broken and fast. That 80.39 was the 1996 point the dollar bounced off - a longer term double bottom.

The rally channel is gone, it is down from here near term. A test of 80 seems a given - the faster it gets there and if it holds 80 is the question.

Now we have to ask is that bullish for US equities as it makes them less expensive for overseas investors or is it bearish in that it says the US government may have trouble attracting interest in those willing to buy its debt. We shall see.


West

Nasdaq % Indicator

Nasdaq percent above their 200 and 50 day moving averages. What is interesting here is back in January 2004 this index topped out near 85%. After that it plunged down to 20% which was a 400 point drop into August of the same year.

So we watched this triangle, can it break out of this 55% area. If it does, the bulls are in control and we have to watch for signs of it to top. If it makes it back to that 80% window, that will be the ultimate topping signal for us in 2006.

So we watch it. One more way to determine to stay in or out of this market.

*Of note, this chart also called the long rallies of May and October 2005, by tagging the bottom of that uptrending channel wedge. The charts never lie. Forget the hype of the media and believe in the technical picture.


West

Friday, January 20, 2006

Volatility - VIX

Bottom forming, looks like it, break of 15.88, until that happens we can say there is ZERO fear in this stock market.

VIX Daily upclose:


The uptrending blue line was from the breakdown after 2002, it is now an important uptrend point and may stop any downside to the markets if it gets hit. As you can see every spike has been met with massive FED liquidity injections.


Lets watch it and I will update this and all past essay charts as things develop.

West

SPX/GOLD flashing Bear Warning

What are these two charts telling us? IMO - the could be sending a signal that the 3 year old bear is about to begin again.


Here is a closeup of the above channel break as of yesterday. This is a serious breakdown. Why has this index followed the SPX to a T till now? Good question.


Here is the long term trendline for the SPX 1000, that is the line in the sand. For deflation and the K wave this has to be taken out or the whole theory is out the window.

We shall continue to monitor this index for clues to the new top in this market. Many signs are flashing and this is just one more.

West

The When and Where of this cycle

The Wedgie - alive and well, talk bear all you want, the bear reflation trade is alive and well. Notice the narrowing wedge. Who will be right Precther or Dent (DOW 35,000)?

SPX:
DOW:
SPX Closeup:
Lets talk cycle, the current Kitchin is now entering its third and final bowl. We have completed 6 Wall Cycles and are entering the final downsloping 3. Logic dictates all cylces begin and end at the same point. But we are in new times with the FED prop job. If the above channel breaks, retests and holds, SELL all your longs. Until then the crowd will buy all dips. Notice the heavy support at 7500, this should hold again, if it breaks we will be in big trouble in America.

The cycles have been running 75 to 95 days on average. So you can see as time goes forward risks to the downside grow.


Happy Investing

West

Thursday, January 19, 2006

Apple vs Dell - a technical view

Apple and Dell - AAPL/DELL - Steve Jobs marked the high water mark for his stock this week by boosting he had a larger market cap than Dell Computer. Well since Dell is getting oversold and nearing a buy point, and Apple has hit its high water mark, he should have kept his boost to himself. Ah egos!


Notice the same pattern in these two charts, Dell showed the same signs just before it topped out. Now ask yourself, these are two box makers, how is one that makes low selling Macs and a gadget that is heading into heavy competition so overpriced compared to a world class player like Dell, in the same market!


The difference, one is priced right in the current cycle and the other is driven on hype. Is it wise to own hyped stocks after these kind of runs. Lots of profit sitting at risk.

Disclosure: I am short AAPL .

West

Wednesday, January 18, 2006

China - via the China Fund

China Fund - CHN

The best way to monitor the health of the China stocks plays. Right now we are testing massive overhead. This should be watched in the days ahead of an indicator if the China market is also topping out again.


Look how that shoulder was held, as good as it gets in a chart.....


West

61.8% - why are markets seeing sell side pressure

Look at this group of charts, London and American markets have retested their 61.8% retracements. This is a major technical area for the markets. The French markets also came within a few hundred points of this milestone. Now look at Japan, they call the bear market over, far from it. Japan is a mess.

France- CAC40


Japan - N225
America - SPX
London - FTSE
West

Nikkei - why todays selloff, here why...

First chart a daily, you can see this is just a simple technical channel test and double top on the overbought indicator. It always is a laugh to watch the media give it a reason with their spin. LOOK at that two year bullish overbought condition, massive Bank of Japan intervention, 35 TRILLION..........


Chart 2: Monthly, what do you see................

Bear or Bull market, B E A R market - a simple oversold, a big one, bounce back to the downtrend line. IF this cannot be taken out deflaton resumes. 4 lower tops, not a pretty chart. Watch it. Notive the overbought condition which led to this selloff, profit taking, pure and simple.


All the best,


West

Tuesday, January 17, 2006

Homebuilding, Bubble Break?

What do we see in these charts, we see market sentiment is at the exterme bullish point, and I feel it shows the overall market sentiment. Extreme BULLISH! When this market sector does break it will be fast and furious.


Now lets compare what you see from this brilliant analyst whom I have followed for years.

http://www.investech.com/

What do his charts tell you!!!! BUBBLE - Thanks Uncle Al......when this breaks the markets go down with them.


West


GOLD Fever

GOLD Fever - it is all over the every web chat thread I read. Let us look at the current situation. First everyone wants a repeat of the 1975 to 1980 massive parabolic gold spike - what drove that, back then it was not fiat money printing and the US economy was in fairly sound shape. Instead of writing the whys, let the chart dictate the trade.


HUI should backtest into the 250 area and could retest that first fib window near 200!

This one chart is what everyone thinks will cause gold to ramp, it has in the past so why not again. The deflation argument could prove wrong, and this chart is predicting this ratio 2013 into 2018. Let the technicals dicate your trade, goldbug or goldbear.

IT ALL COMES TOGETHER at $450 - every technical points to this retest.

--- http://www.zealllc.com/2006/cpigold.htm

Trade to Win

West

M3 Equals Market

M3 can be viewed in this chart, notice how starting in 1995 the FED decided to take the markets into a bubble, WHY, because Greenspan wanted to defeat the K wave. He has long stated how he would love to be FED chairman during a K wave winter, his ego can be seen in this chart. Also not how they created the bust by taking it away and again how they reflated it starting in 2003.


http://www.davidyu.com/

In this chart we see the PPI, notice how decades ago the K wave should have commenced, however instead via massive money printing the FED created massive inflation. Have they defeated the K wave winter?


http://my.net-link.net/~malexan/STOCK_CYCLES.htm

Now we look at the two major indexes, note here how they have followed the M3 chart. Also I think it is important to note how in the past 2 years even with increased M3 injections the markets have remained flat, why?


What we must ask is why in March of 2006 is the FED no longer going to publish this M3 data when it has worked to keep asset prices inflated. It has also been used to create bubbles in housing, gold, oil and everything else the average man needs in life. It has also created global asset bubbles now. The FED is pulling a fast one, they will decrease M3 this year and hope to control the downside, they must pop bubbles again or risk a collapse of the dollar. The FED and its band of private global bankers are not going to destroy a game that has made them the richest group on planet Earth.

No M3 is going away to try and save the dollar, rein in asset bubbles, rabid speculation and the risk of a financial blowup.

The K wave is about to begin again, can they control the downside once it begins. We shall see, but IMO we will see DOW 3000 before free markets see any value in bloated asset prices. Deflation will and must begin for the sanity of the global economy.

West