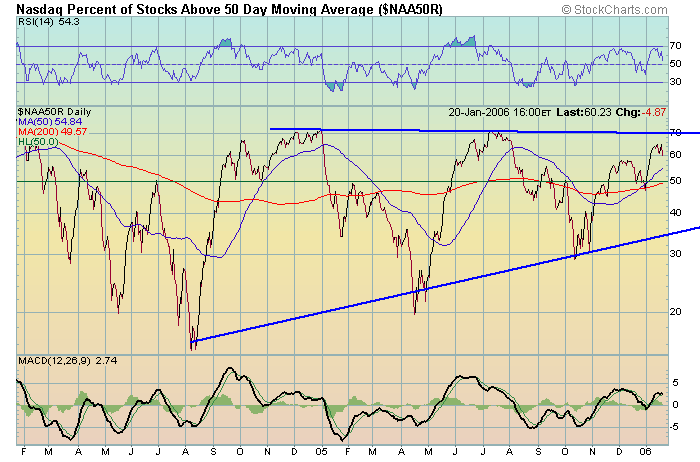
Nasdaq % Indicator
Nasdaq percent above their 200 and 50 day moving averages. What is interesting here is back in January 2004 this index topped out near 85%. After that it plunged down to 20% which was a 400 point drop into August of the same year.
So we watched this triangle, can it break out of this 55% area. If it does, the bulls are in control and we have to watch for signs of it to top. If it makes it back to that 80% window, that will be the ultimate topping signal for us in 2006.
So we watch it. One more way to determine to stay in or out of this market.
*Of note, this chart also called the long rallies of May and October 2005, by tagging the bottom of that uptrending channel wedge. The charts never lie. Forget the hype of the media and believe in the technical picture.

 West
West
posted by Winning Trader @ 11:23 AM
0 comments
![]()

0 Comments:
Post a Comment
<< Home