DOW THEORY - Transports
Dow Theory follows the transportation and energy usage of the world. As long as everyting is hunky dory then it should show in these two areas. I have always been a follower to this day. The Transports are at RECORD HIGHS, and no wonder with what we are bringing in from China these days. But the demand must be there, so far the trend is up, but I see cracks.

Transports daily, negative divergence on the ASX and RSI - since the FED grease job in October. Also the peaks are getting closer and closer and the wedge is getting tight. If it breaks we have a near term top in the DOW. 4300 is the point to break to the downside. Then we should test 3800.
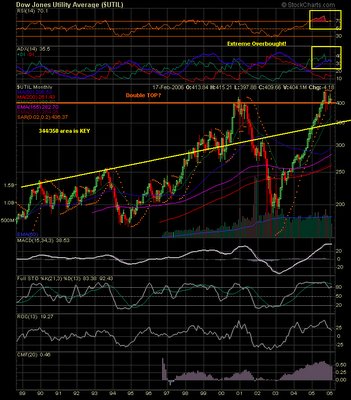
 Transports Monthly, what a chart. Show me the bear market in 2001 in this - there was no bear market! When this incredible channel breaks down this time - now that will be a real nasty bear market! Look at how overbought we are (MACD nearing its previous cracking point), 2006 gonna get ugly and no time to be long this stock market. Just time till this cracks wide open IMO.
Double in just 3 years, NOW THAT IS INFLATION, massive inflation.
3500 Transports, do not be long this market when that day arrives.
West


