Friday, March 02, 2007

Market fall finished?

Market collapse over.......charts speak louder than words.

Note what happens everytime we break down in the Blue Circles. (TRIX overbought/oversold)

Get your crash helmets on.

West


http://stockcharts.com/index.html

Thursday, January 25, 2007

Carry Trade - Yen and Swiss Franc: Relation to markets....


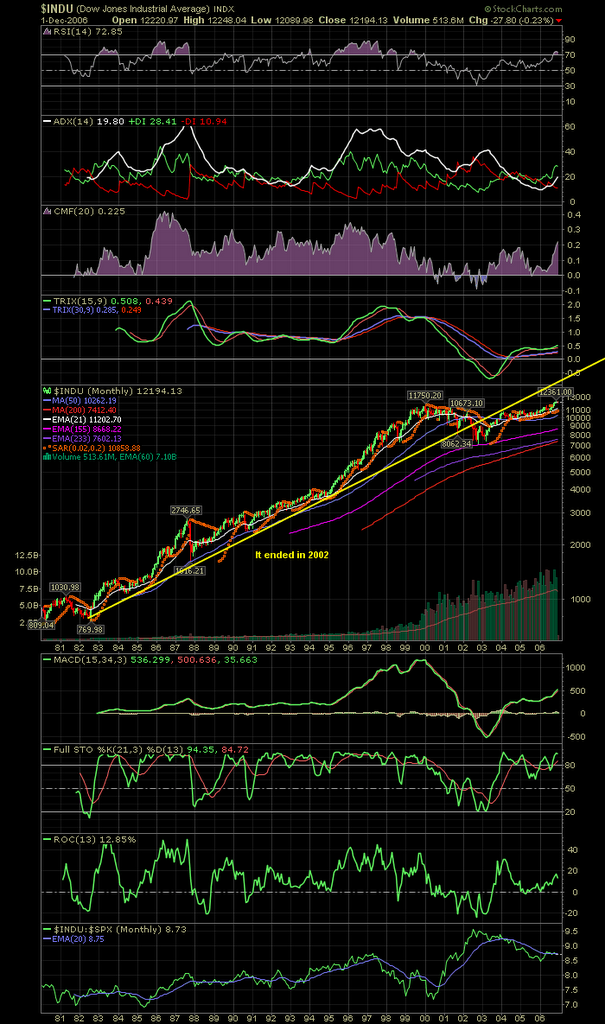
Carry Trade and US markets: Really all that matters...Note the DOW chart for ONE REASON - INVERSE RELATIONSHIP, look what happened to the stock markets back in May when these currencys moved upward. Also note that rise in November, again a reaction in the DOW. The markets anticipated the end of the carry trade and reacted! Then note what happened to the markets once they reversed. This is our investment key for 2007 or at least one of the big ones. -stay invested as long as these stay low, run for dodge on any signs of an upward reversal.
-chart the Yen and Swiss Franc, if they move up and breakout to the upside be careful long the market.
-right now as of today, both are oversold and ready to move up - watch that.

""A key driver of the excess liquidity has been the continued exploitation of the carry trade, in the face of rising rates by Federal Reserve and ECB"".......this is all that matters.

The carry trade is mostly Yen but also they are using the Swiss Currency.

This week:
-Borrow Yen for three months at 0.55%
-Borrow Swissie 2.10%

This week:Invest in....
--Europe 3.5% yield
--US 5.3% yield
--Australia 6.5% yield
--Iceland 15%
--Turkey 19 %
we could go on - you wonder why the Turkish market has skyrocketed........

--note this statisticHungarian homeowners in the second quarter of 2006, 74% of all mortgage refi's by the top bank were dominated in foreign currency, primarily Swiss Francs!

--Most of the carry trade is with borrowed money!

The Yes and Swissie hold keys to the market and your portfolio health .The CBs are fueling asset bubbles in every asset class including global property booms, art and whatever else speculators are chasing.

West

Sunday, December 03, 2006

397 and 403 Month Cycle

There is a theory. It is called the 397 and 403 month cycle.

August 1896, a new bull market that finished in September 1929, it lasted 397 months.

July 1932, a new bull market that finished in Febuary 1966, it lasted 403 month.

December 1974, a new bull market that finshed in ?

January 2008 is 397 months, July 2008 is 403 months.

Be very careful if we still have a bull market ragin going inot 2008.

West


Both of the past cycle collapses wiped out over 50% of the markets value, that did not occur when we topped out in 2000.

Two old timers that follow the market and use different models have the market topping:
1) in the high 14,000s
2) in the 17,000s

Before this cycle ends, could 2007 be the blowoff year with just a massive upward spike like in 1998 and 1999.

We shall see.

West

Real Estate Top?

Chart 1 - Real Estate ETF


Chart 2 - REITs

Chart 3 - Real Estate Short Fund


Not even close, I keep reading everywhere how real estate has topped out. Not until early 2007. My feeling is this top out will be what also leads the stock markets lower.

More on that in another post to follow. Let these three charts determine the real estate top, not the unlimited news feed from every source on the globe. My wife is selling a 35 unit condo project within walking distance to the sea in a market in Europe. Sales are brisk.

Will update on this going forward quarter to quarter.

West


Sunday, October 22, 2006

Dow Jones World - Market TOP?

Is this the chart of the year or what?

It could hold the keys to telling us when to sell out of this market, it marked the top back in 2000 and holds all the same technicals again here late 2006.

Study and ponder.


West

Friday, September 22, 2006

50 DMA Weekly paints the bearish TRUTH!

Take a look at this and then tell me you are BOOISH.......

West


Friday, September 15, 2006

GOLD Update


Is the bull market in gold over, forget all the hype, follow the charts - they factor in what the real picture is. The rest, well it is just worthless.

West

Precipice Finish


Precipice - The brink of a dangerous or disastrous situation, on the precipice of defeat.....

This is what your FED is fighting, outright deflation and right ahead of November elections. Once this breaks we will have a comeback rally - at what bottom, retest of 10683, more like 10,000 (big technical support here) or even lower 8528 if we break 10,000.

Near term, get out of stocks under:
11032, 10960 and 10900 these are key supports for the month of September.

Once this collapse occurs and it will, we should see a retrace of upwards of 55%, it happened in 1929. But after this retrace expect the final blow to this whole FED created liquidity mess, how low, the Elliott Wave Boys still have a DOW 400 target. Lets just say it will not be pretty.

West

Monday, July 17, 2006

DOW 10680 area - Critical


The DOW has seen major support/resistance at this 10680 area since 1999.

Right now it is critical for the market to hold this, or if we do get a break down to a target around 10,000 to 10,200 and then a rally retest and failure at this level, the bear market will have begun again.

Lets watch it develop.

West